Gosport and Fareham coronavirus statistics hide wide local variations
Chief Correspondent Rob Thomas explores the latest coronavirus statistics…
BOTH Gosport and Fareham have recorded above average rates of coronavirus cases but equally worrying is the variation between areas within the boroughs.
In the week ending on Monday, August 23, there were 303 cases of Covid-19 in Gosport and 418 in Fareham but when standardised for the different population sizes of the two boroughs, the rates per 100,000 people were 358 and 359 respectively.
For comparison, the standardised rate was 457 for Portsmouth and 399, Havant, while that for the average area in England stood at 315.
Therefore, the rate for Portsmouth was more than 27 percent higher than for neighbouring Gosport or Fareham but that variation was well below the differences within each of the boroughs.
Data published by the Government includes the standardised rates for what are termed, ‘Middle layer Super Output Areas’ which are smaller than boroughs but do not necessarily coincide with ward boundaries – for example, the Priddy’s Hard & Brockhurst MSOA is not a council ward.
Using these statistics, in Gosport the standardised rate – again, per 100,000 people – for Clayhall & Anglesey at 557.6 was nearly three times higher than Elson’s 187.8.
In Fareham, the within-borough variation was less but still marked with Park Gate & Segensworth’s rate of 528.3 being 140 per cent higher than the rate of 219.7 in Hill Head.
Given the publicity about the importance of vaccination, it would be easy to jump to the conclusion that some – maybe, most – of the differences in rates is due to different vaccination take-up rates but this is not completely borne out by the data.
While in Fareham the percentage of those aged 16 years and above who had had both doses was 87.4 per cent, the figure for Park Gate & Segensworth was 83.5 per cent, but in Gosport Clayhall & Anglesey and Elson in Gosport had identical double-jab rates of 81.7 per cent.
The statistics for MSOAs is available at: www.coronavirus.data.gov.uk/ and includes a search facility using postcodes and an interactive map.
It is worth noting that though the figures above seem large, the actual number of cases can be relatively small: thus, although the standardise rate for Clayhall & Anglesey was 557.6, the number of cases reported in the MSOA was 43 in the week ending August 23.
And secondly, the data provides a weekly snapshot of the situation but what the weeks and months of the pandemic have shown is that the national, regional or local incidence of coronavirus can change quickly.
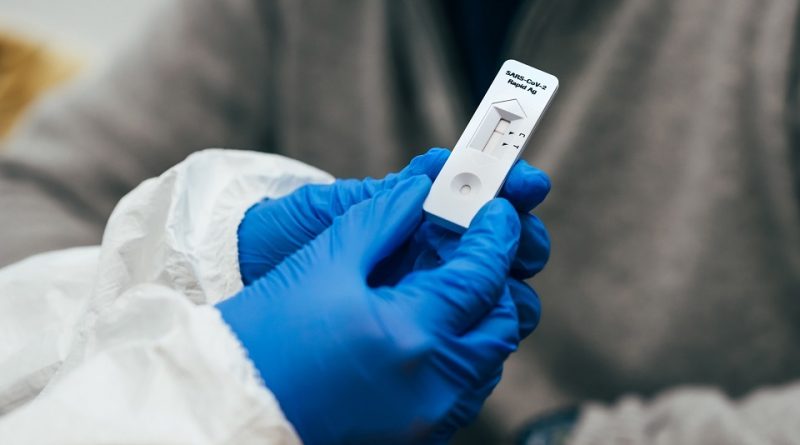
Photo (top): testing for coronavirus. From Gov.UK, Crown copyright


